Visualizing PageRank using networkx, numpy and matplotlib in python
March 07, 2020
Today I wanted to understand how the PageRank algorithm works by visualizing the different iterations on a gif. But to make the exercise more complicated (interesting ;-)), I also wanted to implement my own PR algorithm using matrix formulation.
PageRank with matrices
Implementation
In terms of implementation, I decided to rely on the networkx representation of graphs and their methods such as adjacency_matrix. The graph is created using for instance:
import networkx as nx

G = nx.read_edgelist("test_graph.edgelist")
Then, we just need to iterate for a maxium of max_iter, or until the desired mean error is reached. At each step, the PageRank is updated with:
pr = d * weight.dot(pr) + (1-d)/N
Where the weight matrix is a NxN matrix whose ij element is the weight between node i and j (1/deg(j)).
The full code is reproduced here:
import numpy as np
def page_rank(G, d=0.85, tol=1e-2, max_iter=100):
    """Return the PageRank of the nodes in the graph.

    :param dict G: the graph
    :param float d: the damping factor
    :param flat tol: tolerance to determine algorithm convergence
    :param int max_iter: max number of iterations
    """
    nodes = G.nodes()
    matrix = nx.adjacency_matrix(G, nodelist=nodes)
    out_degree = matrix.sum(axis=0)
    weight = matrix / out_degree
    N = G.number_of_nodes()
    pr = np.ones(N).reshape(N, 1) * 1./N

    # need to repeat the initial step twice
    # for matplotlib animation
    yield nodes, pr, "init"
    yield nodes, pr, "init"

    for it in range(max_iter):
        old_pr = pr[:]
        pr = d * weight.dot(pr) + (1-d)/N
        yield nodes, pr, it
        err = np.absolute(pr - old_pr).sum()
        if err < tol:
            return pr
    #raise Exception(f'PageRank failed after max iteration = {max_iter} (err={err} > tol = {tol})')
The resulting values for PageRank using this implementation are compatible with the ones obtained with the networkx implementation:
# Custom page rank:
[[0.05427205 0.14652879 0.05427205 0.08972923 0.12543861 0.1398845
  0.11906867 0.0530322  0.0530322  0.08237085 0.08237085]]
# network page rank:
{'1': 0.05472174724228272, '3': 0.14500947724655655, '2': 0.05472174724228272, '4': 0.09022185969480352, '5': 0.1252959204066461, '6': 0.13952052031260131, '9': 0.1192351424187364, '7': 0.05316762893415654, '8': 0.05316762893415654, '10': 0.0824691637838888, '11': 0.0824691637838888}
This function can then be used within a matplotlib animation to visualize the rank evolution until convergence.
Visualization
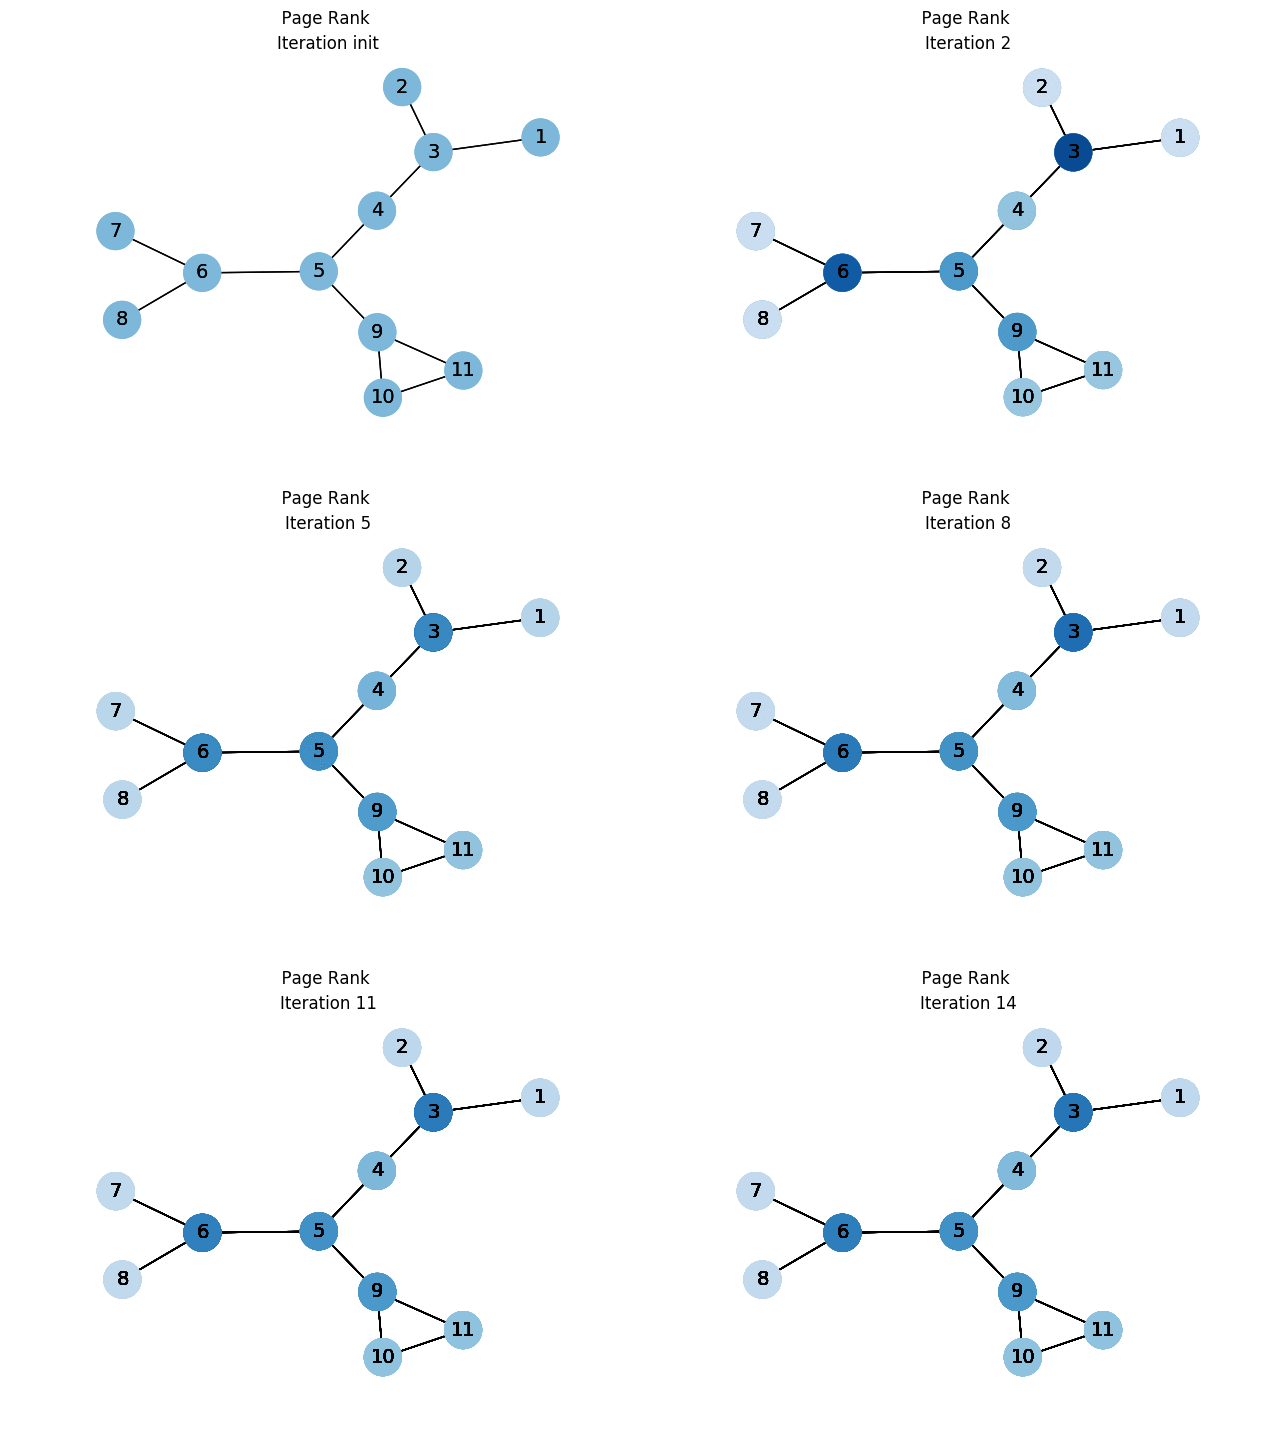
Since the function was implemented as a generator, yielding the current ranks at each iteration, we can directly use it in a FunctionAnimation. We just need an update function, that will actually draw the graph with node colors depending on the rank (the darker the blue, the highest the rank):
import matplotlib.pyplot as plt
from matplotlib.animation import FuncAnimation


def update(r):
    res_nodes, res_values, it = r
    res_values = np.asarray(res_values).ravel()
    plt_nodes = nx.draw_networkx_nodes(
        G, pos,
        ax=ax,
        nodelist=res_nodes,
        node_color=res_values,
        alpha=1,
        node_size=700,
        cmap=plt.cm.Blues,
        vmin=0,
        vmax=0.2
    )
    ax.axis("off")
    ax.set_title(f"Iteration {it}")
    nx.draw_networkx_edges(G, pos)
    nx.draw_networkx_labels(G, pos, font_size=14)
    return [plt_nodes, ]


G = nx.read_edgelist("test_graph.edgelist")
pos = nx.kamada_kawai_layout(G)

f, ax = plt.subplots()
ani = FuncAnimation(
    f,
    update,
    frames=page_rank(G),
    interval=1000,
    blit=True
)
f.suptitle(f"  Page Rank")
ani.save("graph_pr.gif", writer='imagemagick')
The result of this code is the following animated gif, where one can clearly see the rank distribution, especially during the first steps:
